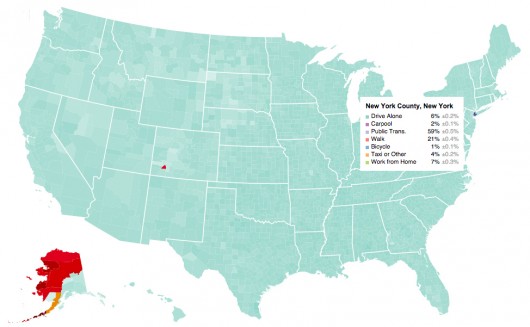
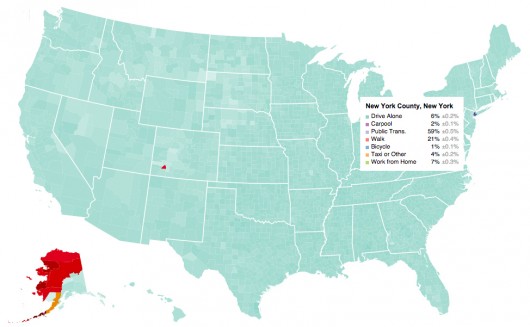
In the US, most people drive alone to work. This isn’t surprising, considering car culture has been a staple of American life since the end of World War II. However, with the potential of high speed rails making way in California and the push for public transit in many other states, it will be interesting to see how this map may (or may not) change over the next decade.
This interactive infographic, provided by flowingdata.com, illustrates the work-related usage rates for all varying modes of transportation throughout every county in the US. Click here to see.
How Americans Get to Work originally appeared on ArchDaily, the most visited architecture website on 25 Jan 2015.
send to Twitter | Share on Facebook | What do you think about this?
Source:: http://feedproxy.google.com/~r/ArchDaily/~3/z8fM3srbYvo/